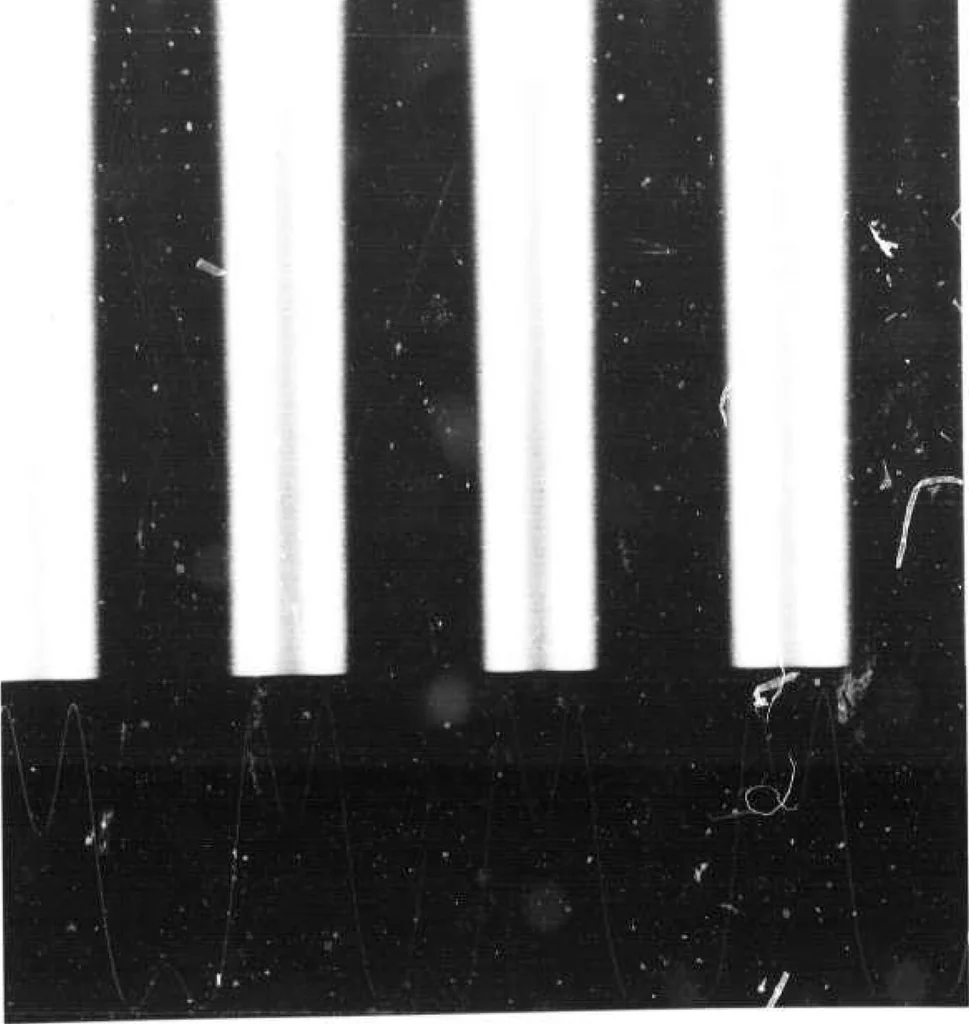
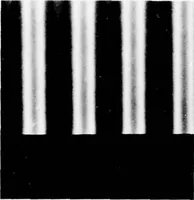
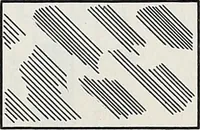
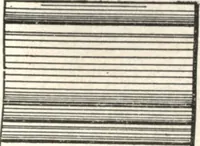
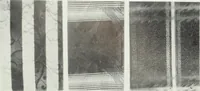
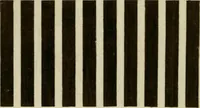
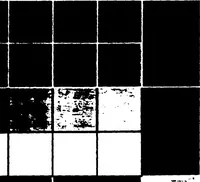
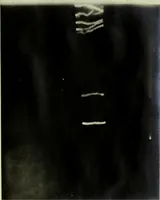
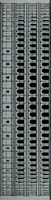
Figure 7. Sinusoidal test pattern corresponding to the density function: k, sin(2irfx) + 0.5 k-| sin(6nf><). Shows the result of compensating for brightness contrast the pattern of Figure 6 according to the average data from the experiment.
Evans, David C · Stockman, Jr, Thomas G · Utah univ salt lake city · Computer graphics · Image processing · Computer programming · Interactive graphics · Man machine systems · Waveforms
Internet Archive · Defense Technical Information Center · Public domain (US government work). Free to use for anything.