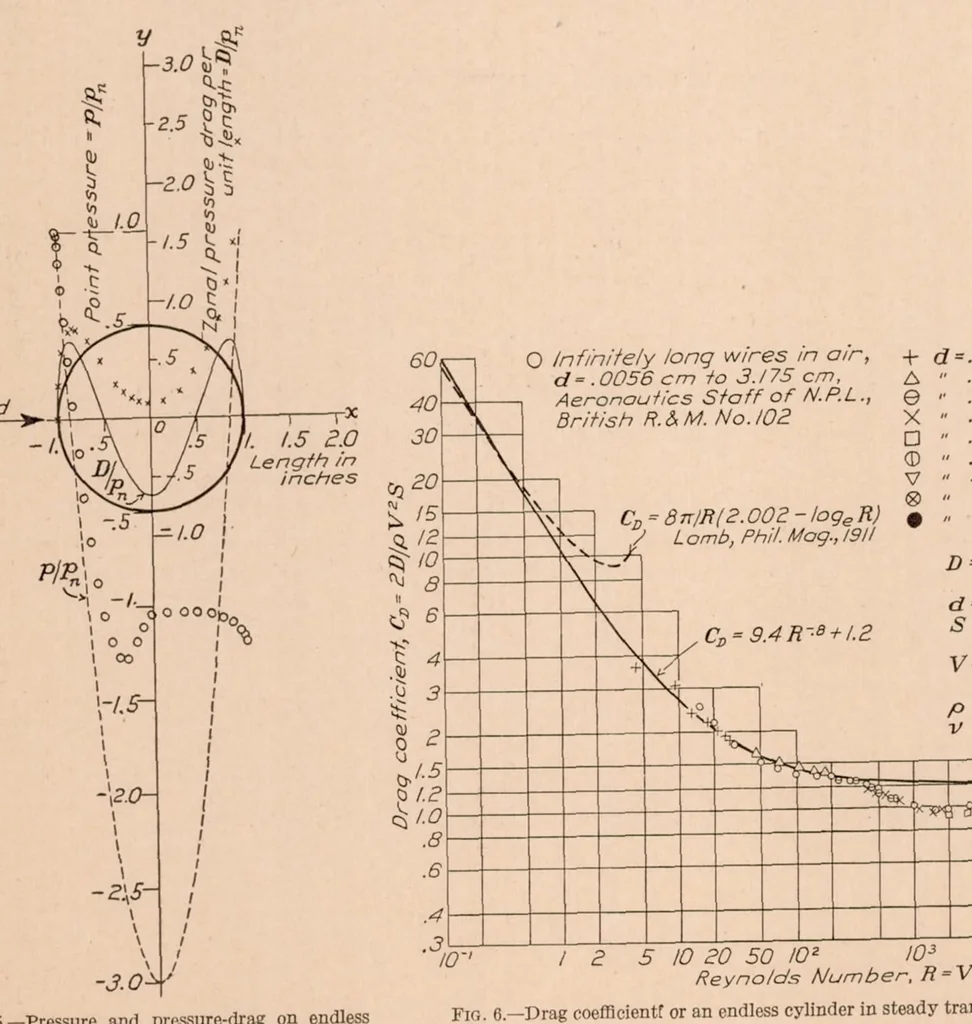
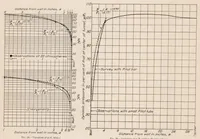
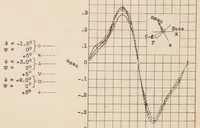
Fig. 4—Velocity and pressures along axes and over surface of endless cylinder; graphs indicate theoretical values; circles indicate pressures measured at 40 miles per hour in 8-foot wind tunnel, United States Navy … Fig. 5.—Pressure and pressure-drag on endless cylinder. Graphs indicate theoretical values; circles indicate pressure vlPn measured at 40 miles per hour; crosses indicate pressure-drag DJpn computed from measured pressure
NASA Technical Reports Server (NTRS)
Internet Archive · NASA Technical Reports · Public domain (US government work). Free to use for anything.