Working charts for the determination of the lift distribution between biplane wings (1934)
NASA Technical Reports Server (NTRS) · leaf 13
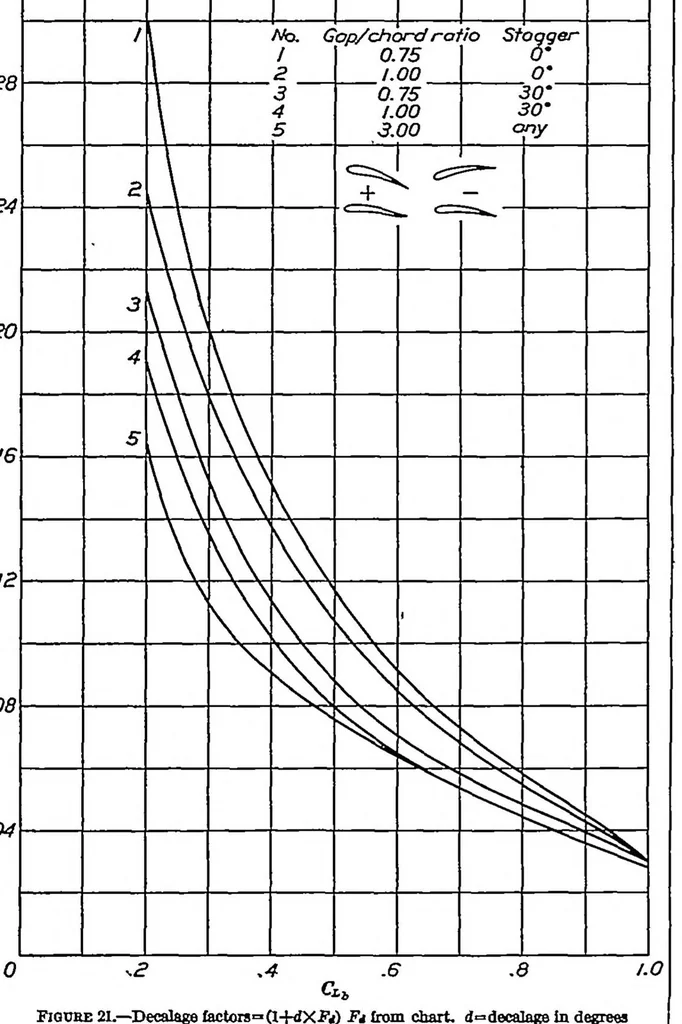
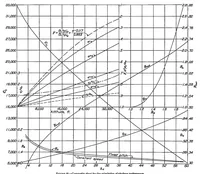
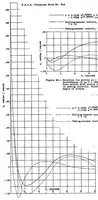
.5, and the Fa curve for (O/c = 3) interpolate to obtain the stagger=30° from Figure 19. Fi curve for ((?/<;■= 1.25, stagger=17°). (2) B values for stagger = 0°. Example.—The following is an example of the pro- (3) O/c factor for (camber+thickness) = 15.5, stag- cedure for finding B against GLb in… … Figure 21. Figure 2L—Decalage Iactors=CH-<fXfV) Ft from chart. d=decalage In degrees (13) Decalage factors for (?/c = 0.9, stagger = 30° DATA obtained in a manner similar to (12). Airfoil—Clark Y (14) Difference between (12) and (13). Camber+thickness: 15.5. 13 (15) = (14) X g-Q (interpolating for…
NASA Technical Reports Server (NTRS)
Internet Archive · NASA Technical Reports · Public domain (US government work). Free to use for anything.