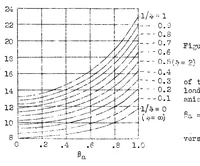
Working charts for the determination of the lift distribution between biplane wings (1934)
NASA Technical Reports Server (NTRS) · leaf 5
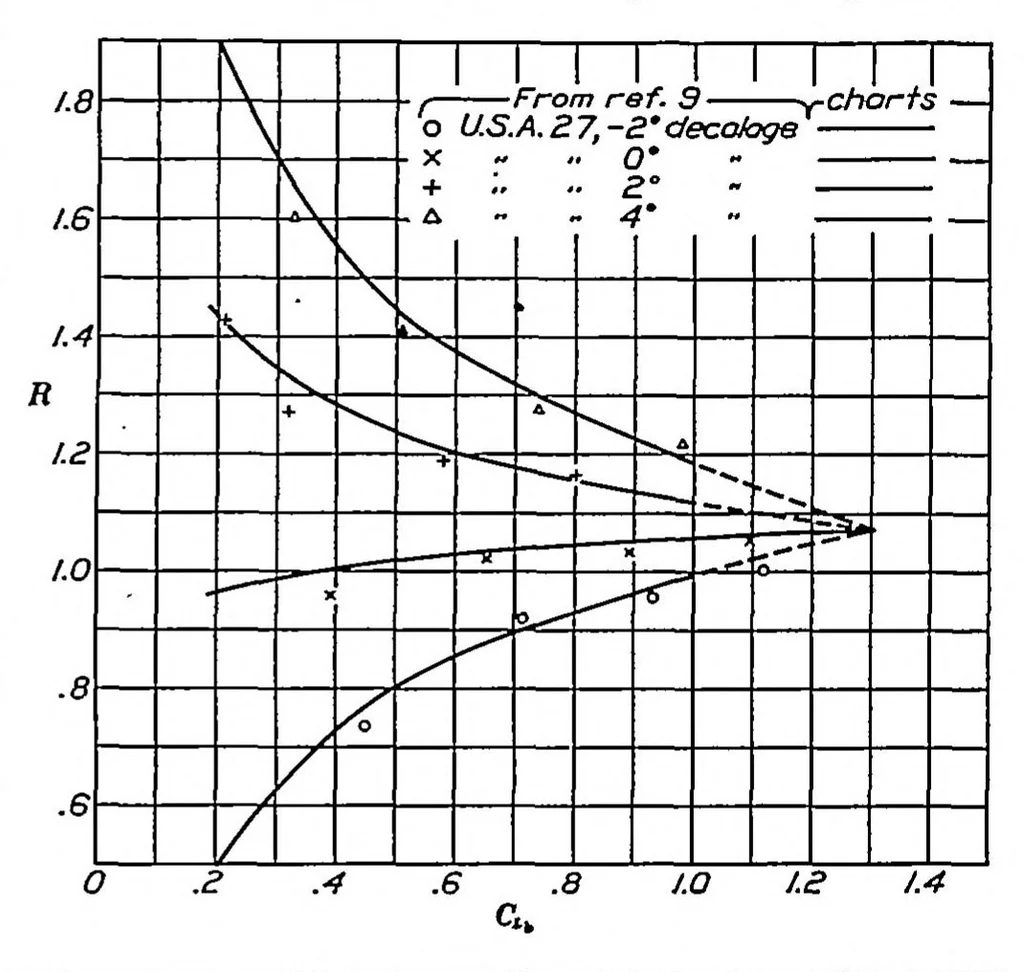
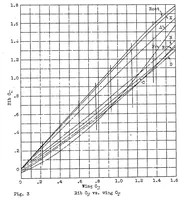
of increasing the aspect ratio above 6 Below (7^ = 0.2 the test results scatter so badly that up to the practical limit probably has not much in- the curves were discontinued at this point. fluence on the lift distribution. One test at aspect As the burbling point depends on the Reynolds ratio 5.6… … Alrfoa. Clark Y U. S. A. 27 Airfoil Maximum mean camber, per cent chord. 3.8 Maximum thickness, per cent chord 5.4 11.7 Maximum mean camber, per cent chord.. Gap/chord ratio , .78 U.0 Maximum thickness, per cent chord Chord ratio 10 Gap/chord ratio - 1.0 Decalage, degree 0 1.0 Chord ratio…
NASA Technical Reports Server (NTRS)
Internet Archive · NASA Technical Reports · Public domain (US government work). Free to use for anything.