Brinton, Willard Cope, 1880- · New York, The Engineering magazine company · leaf 112
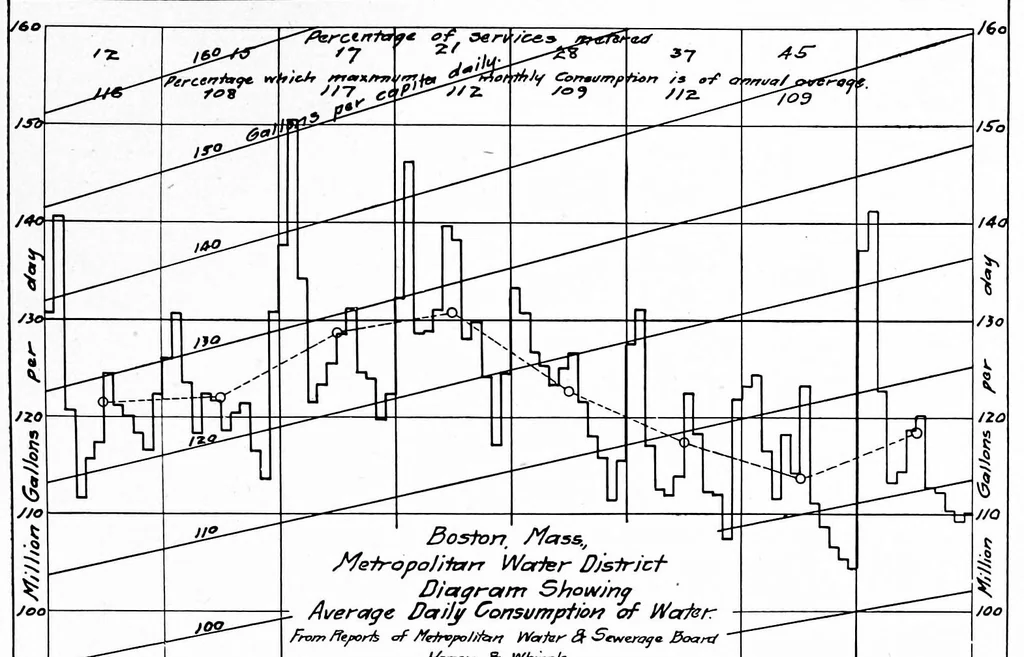
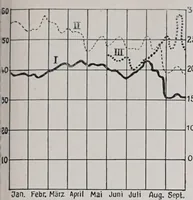
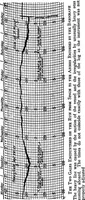
95 CURVE PLOTTING … M^xen & Whipple /9'J 9" Jioy J90& 110^ '»"» w-r ^"9 /9/0 /9'l /git. Counesy of Hazen & Whipple, New York Fig. go. Chart Showing by Months the Average Total Daily Water Consumption in Boston, and by Months the Average DaUy •per Capita Water Consumption. Also the Yearly Average of Daily Consumption…
Graphic methods · Statistics
Internet Archive · Cornell University Library · Public domain (published before 1931). Free to use for anything.