Brinton, Willard Cope, 1880- · New York, The Engineering magazine company · leaf 136
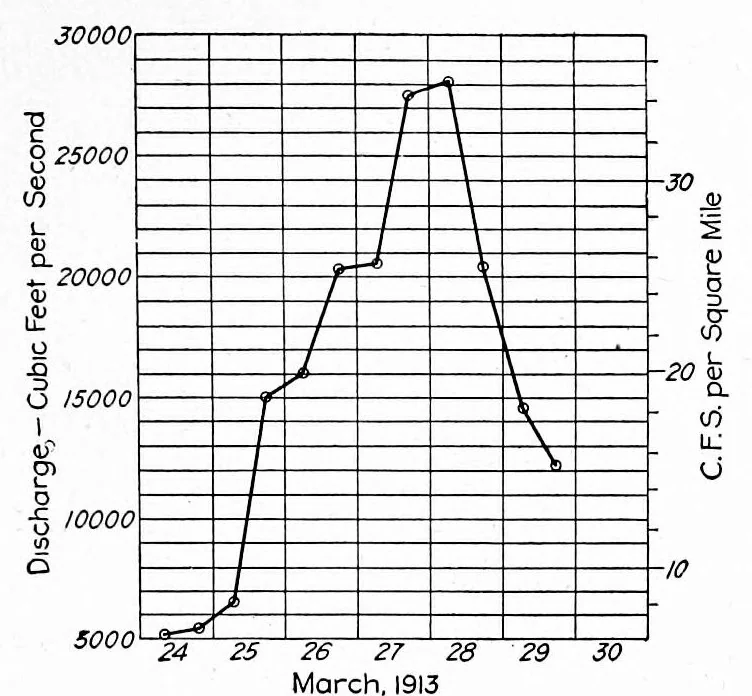
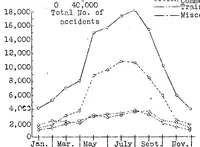
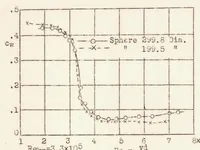
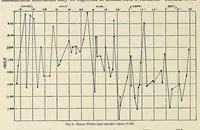
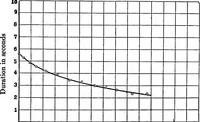
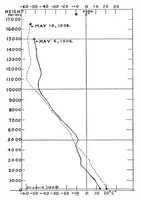
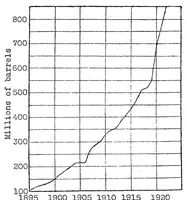
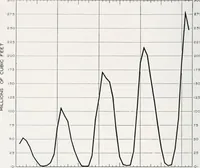
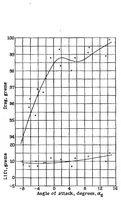
119 COMPARISON OF CURVES broken oflf, most readers will not imagine correctly the great height to which that peak would extend if it were shown in full. The chart could have been greatly improved if the upper portion of the peak had been drawn in full size horizontally as though hinged near the… … March, 1913 ■ March. 1913 Engineering Reeord Comparison of Flood Rise in Two Rivers in New York State During the Fig. io8. Floods of March, 1913 In the preceding illustrations of this chapter there has been such similarity in the shape of the curves con- sidered that they were superimposed for…
Graphic methods · Statistics
Internet Archive · Cornell University Library · Public domain (published before 1931). Free to use for anything.