Brinton, Willard Cope, 1880- · New York, The Engineering magazine company · leaf 140
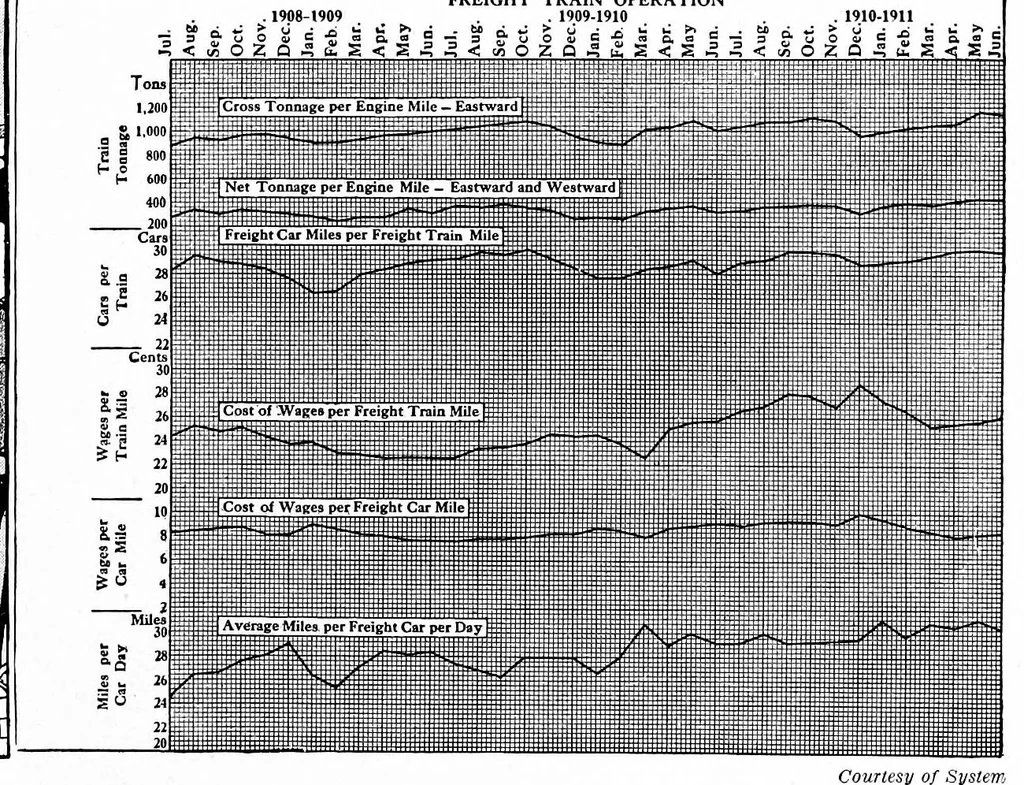
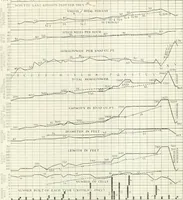
e different horizontal lines will be represented by the figures 0, 7, 14, 21, 28, etc. The data for "corn yield" can then be plotted to the new scale, and it will be found that the new curve does not coincide with the "rainfall" curve as closely as does the "corn- yield" curve shown in Fig. 114.… … Courtesy of System Fig. 113. Records of Freight-Train Operation on a Large Eastern Railroad Here, as in Fig. 112, the ^ero lines are not given and the reader must watch the left-liand scales carefully to study percentage fluctuation. Comparison between curves cannot be made accurately by judging…
Graphic methods · Statistics
Internet Archive · Cornell University Library · Public domain (published before 1931). Free to use for anything.