Brinton, Willard Cope, 1880- · New York, The Engineering magazine company · leaf 144
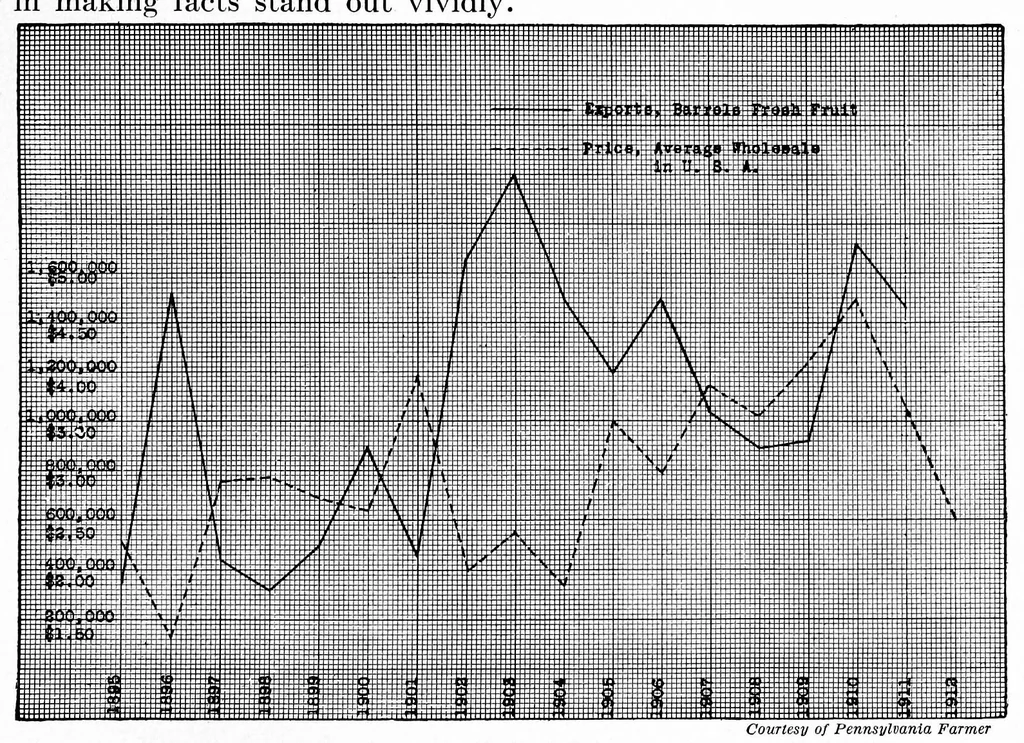
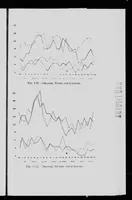
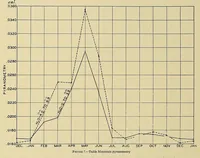
the second chart should be the same as those for the first chart, so that there may be no "faking" in any similarity which may show up in the shapes of the two curves. It frequently happens that the relations between two curves are such that the most striking presentation can be obtained by… … CoiiTlcsy of Penn.il/tvanta Farmer Fig. 117. Exports of Apples from the United States as Compared with the Average Wholesale Price in the United States A little inspection shows that the export curve usually goes up when the price curve comes down. Though this fact indicates an inverse relation…
Graphic methods · Statistics
Internet Archive · Cornell University Library · Public domain (published before 1931). Free to use for anything.