Brinton, Willard Cope, 1880- · New York, The Engineering magazine company · leaf 145
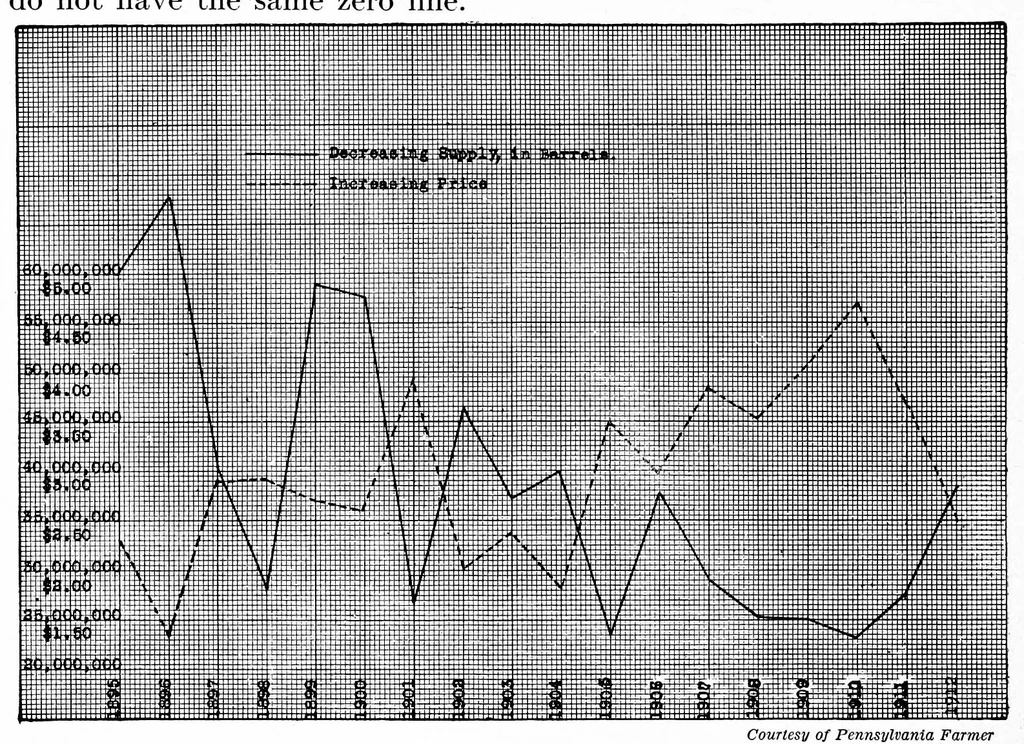
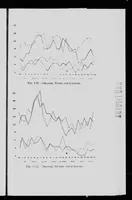
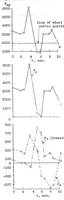
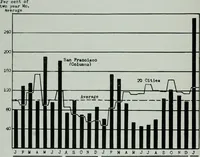
128 GRAPHIC METHODS for exports to decrease as prices increase, there would seem to be so many complex factors entering into the relation that no very gen- eral law of dependence can be proved. It can be seen from inspection that the relations existing between the two curves of Fig. 118 are much… … Courtesy of Pennsylvania Farmer Fig. ii8. The Average Price of Apples in the United States as Compared with the Total Supply Here again an inverse relation is indicated, but the chart has carelessly been made with the two vertical scales starting from separate zero lines so as to cause distrust by…
Graphic methods · Statistics
Internet Archive · Cornell University Library · Public domain (published before 1931). Free to use for anything.