Brinton, Willard Cope, 1880- · New York, The Engineering magazine company · leaf 160
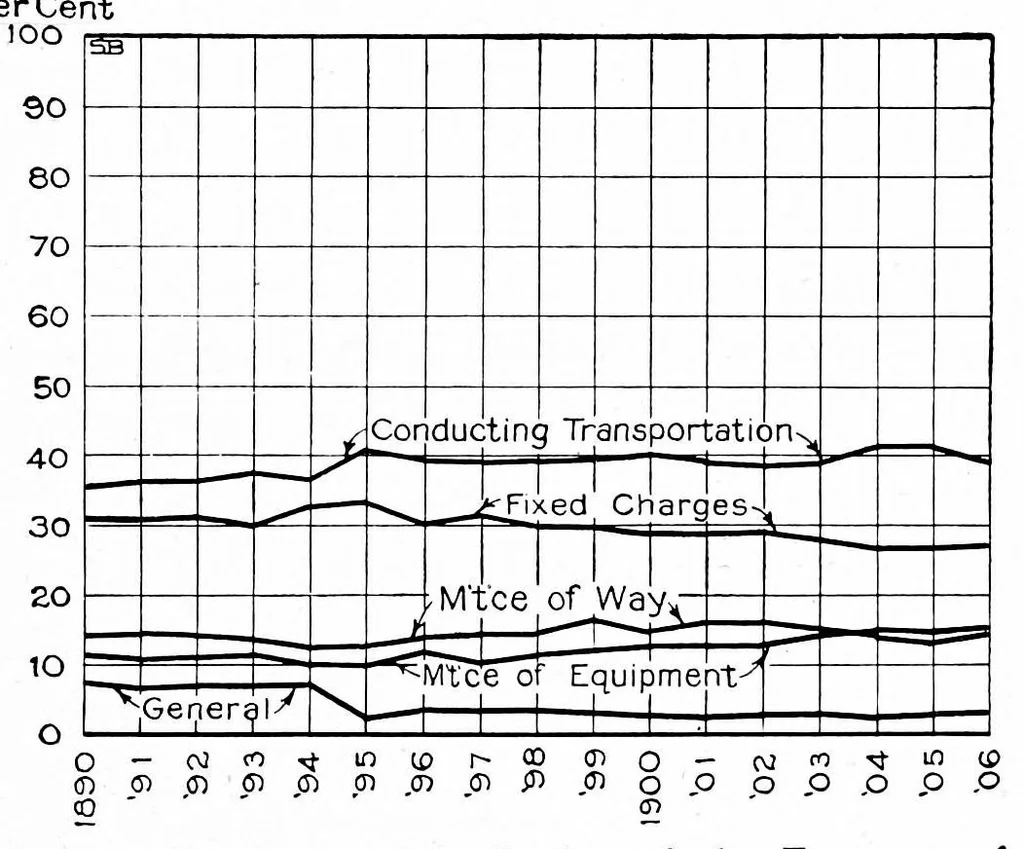
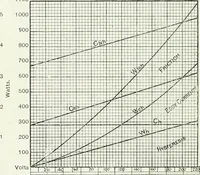
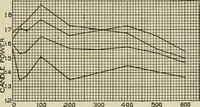
of Fig. 129 with a common zero line, or in the form of Fig. 131, where each factor has its own separate base line, or in the form of Fig. 132 and Fig. 133, in which the lines on the chart represent actual quantities rather than percentages of an aggregate or total sum. Note in Fig. 130 and Fig. 131… … Aveeks in a year, of Fig. 129. Percentage Distribution of the Expenses of Operating the Raihroads of the United States. The course are necessary Combined Height of All the Curves Shown Equals when the paper is 100 Per Cent on the Scale used to represent This illustration represents the same data as…
Graphic methods · Statistics
Internet Archive · Cornell University Library · Public domain (published before 1931). Free to use for anything.