Brinton, Willard Cope, 1880- · New York, The Engineering magazine company · leaf 164
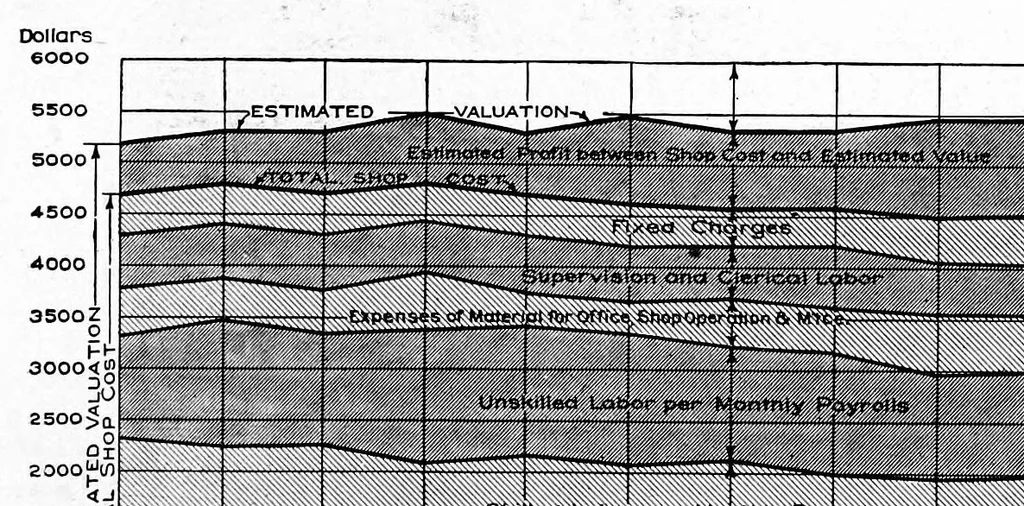
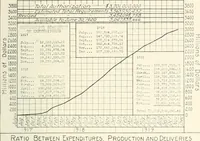
nd to the chart itself. The important part of the chart ends at the top of the shaded area. We may consider the top of the whole shaded area as a curve and read the values accordingly from the scales on the right- and left-hand sides. In fact, any curve on the whole chart may be considered as a… … <J ISOOih -P 1500 lOl- looof 1O0O ■ P^"iai.:.l on ><fi:.;::::/k.,.,. J 500 I i ■ t— - ! Apr May June July Aug Sept Nov Dec Adapted from Factory Fig* 133* Factors Entering into the Total Costs and Estimated Value of the Product of a Manufacturing Plant The various elements entering into total shop…
Graphic methods · Statistics
Internet Archive · Cornell University Library · Public domain (published before 1931). Free to use for anything.