Brinton, Willard Cope, 1880- · New York, The Engineering magazine company · leaf 182
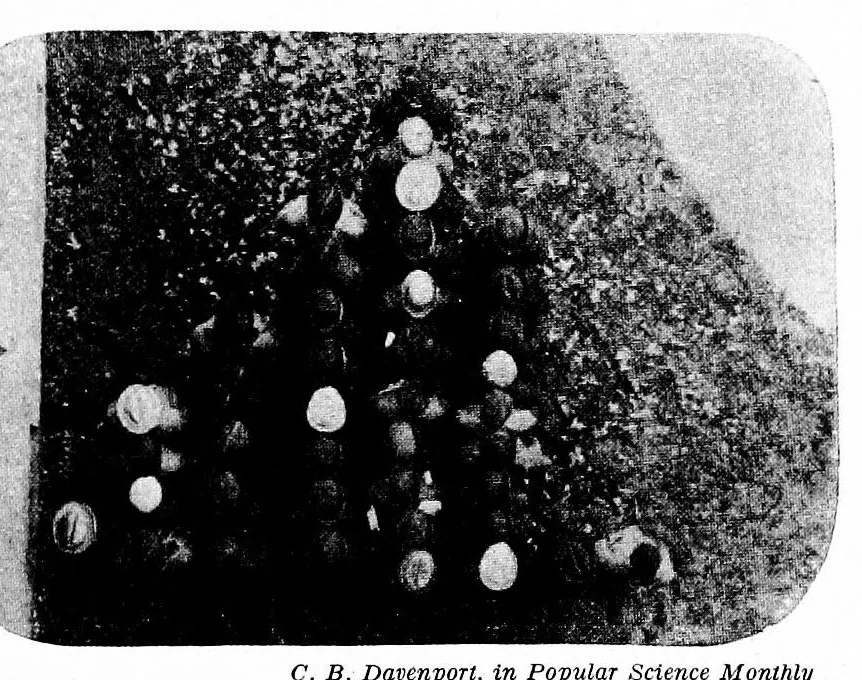
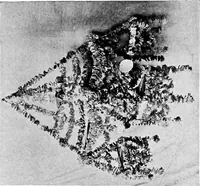
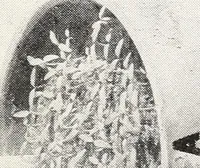
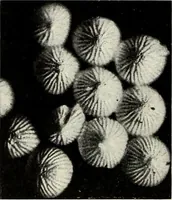
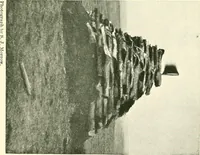
165 FREQUENCY CURVES relating to the frequency with which different characteristics or items are found repeated is commonly referred to by the biologist as "fre- quency distribution", and the charts showing frequency are quite often called "distribution charts" or "distribution curves". In Fig. 140… … have seventeen ribs. There C. B. Davenport, in Popular Science Monthly 141. Forty University Students Arranged in Fig. is a fairly large number of Rows, According to Stature by Inches, as shells in the pile for sixteen follows: 56 to 57.9, 58 to 59.9, 60 to 61.9, 62 to 63.9, 64 to 65.9, 66 to 67.9,…
Graphic methods · Statistics
Internet Archive · Cornell University Library · Public domain (published before 1931). Free to use for anything.