Brinton, Willard Cope, 1880- · New York, The Engineering magazine company · leaf 191
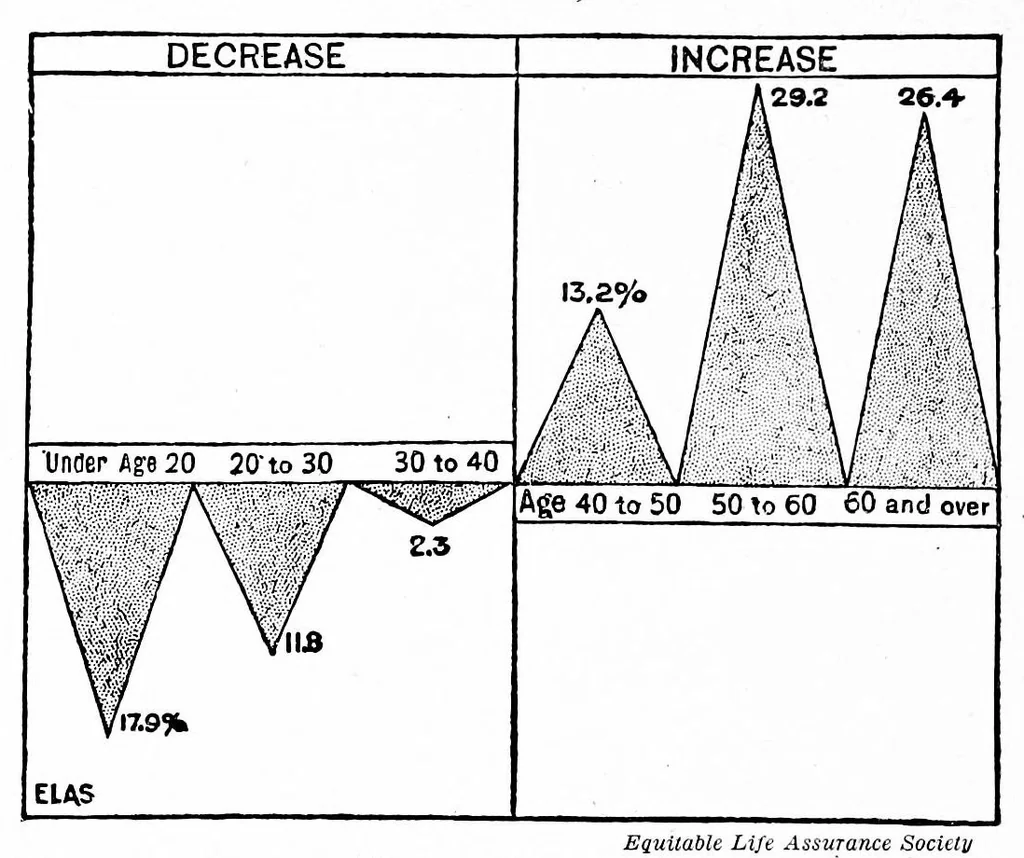
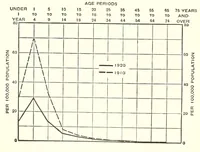
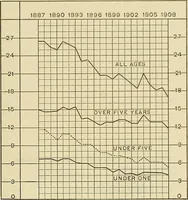
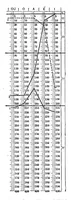
174 GRAPHIC METHODS by the use of bars. Granted that the curve of Fig. 149 might not be understood by all the readers of a newspaper, it is nevertheless much more desirable, even in newspaper work, than the method shown in Fig. 148. Though Fig. 149 might not attract deep interest on the part of a… … zontal scale. Thus, Bquitable Life AssvTance Society Fig. 148. Change Since 1880 in the Death Rates of in Fig. 143 (see page Americans at Various Ages 167) we can read The use of the separate triangles here is confusing to the reader. One is apt to interpret the chart by the contour of the shaded…
Graphic methods · Statistics
Internet Archive · Cornell University Library · Public domain (published before 1931). Free to use for anything.