Brinton, Willard Cope, 1880- · New York, The Engineering magazine company · leaf 228
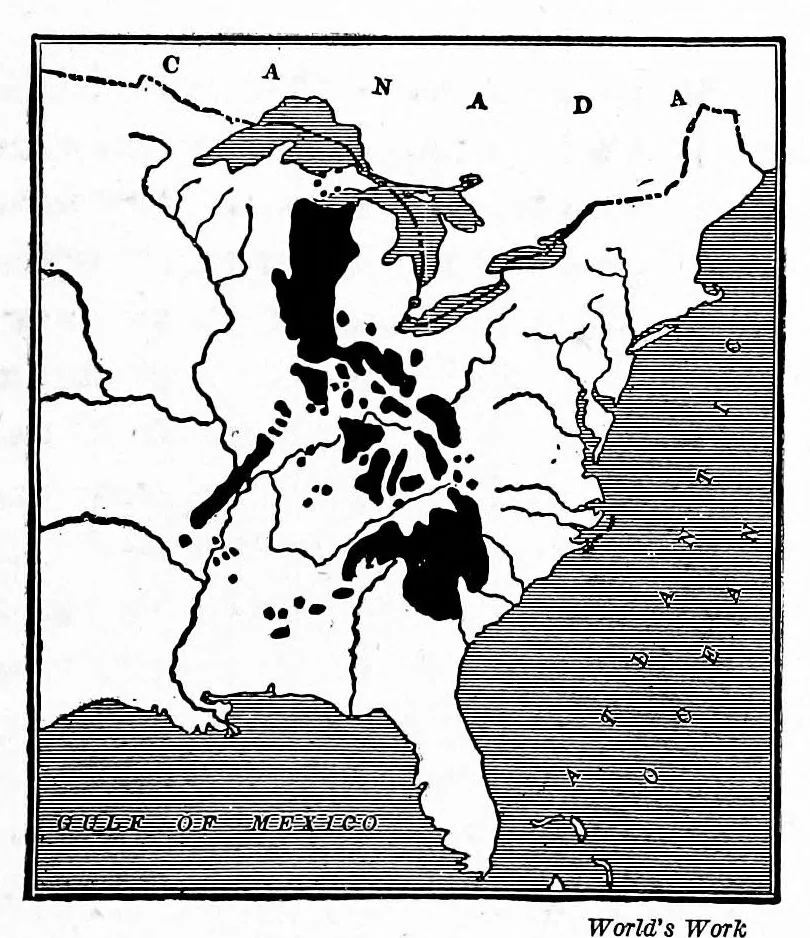
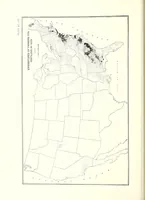
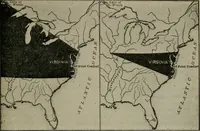
ny readers as similar in general scheme to the weather maps on which lines are drawn through all points having the same temperature or the same barometric pressure. Contour lines to show those points which are at the same height above sea level give another application of the same general method.… … Fig. 170. The Comparative Size of the \^^*^ ^« ^^^ °^^ ^^^'^^^ ^^^ ^^^^^^ Philippines of the chart. By drawing the islands to scale and in solid black Considerable time and ingCUU- on a map of the eastern part of the United . i • i • States, the relative size is clearly brought out ity may be UScd…
Graphic methods · Statistics
Internet Archive · Cornell University Library · Public domain (published before 1931). Free to use for anything.