Brinton, Willard Cope, 1880- · New York, The Engineering magazine company · leaf 231
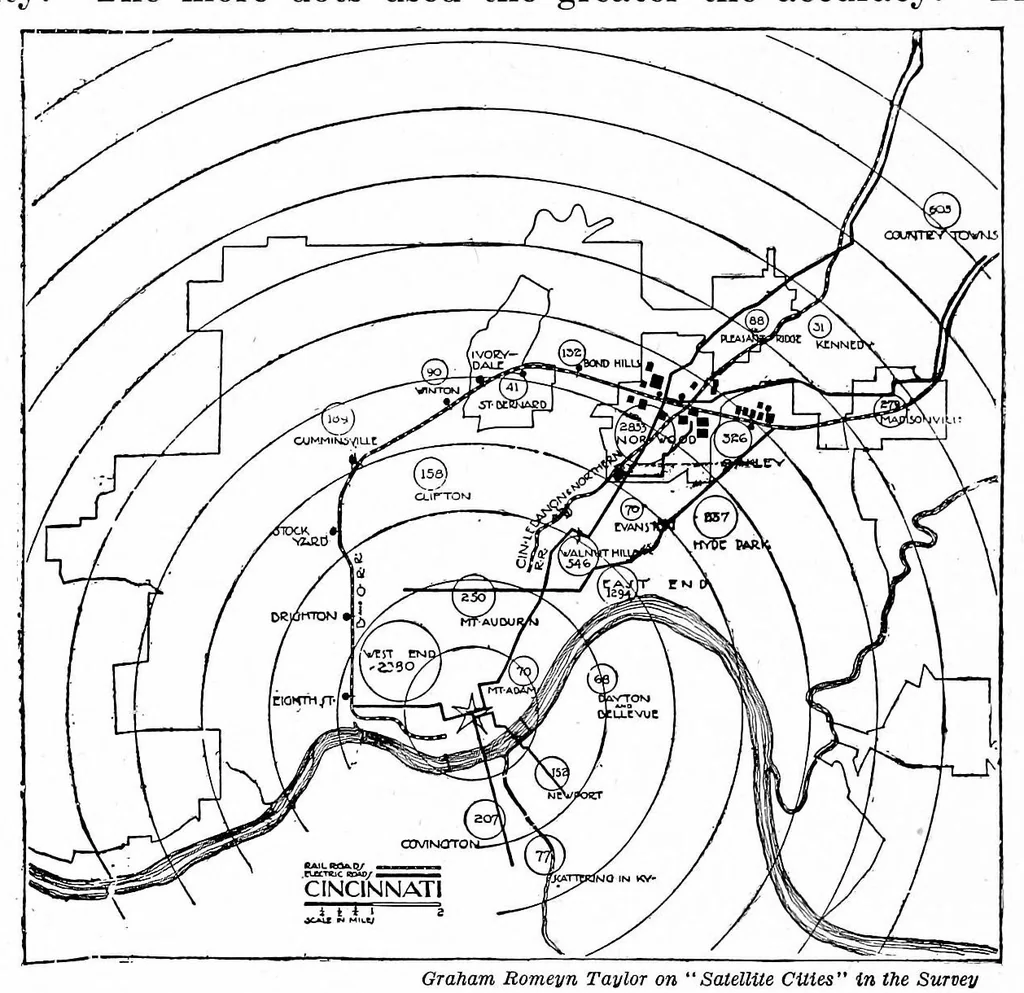
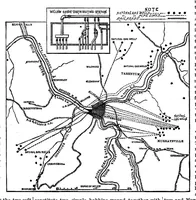
Idaho and Texas are compared. The method of Fig. 176 is now quite commonly used in Govern- ment publications. This scheme for presenting data is not so striking to the eye as that of Fig. 175, but it is more accurate. The scale given with the map permits the number of cattle for any State to be… … GTaham Romeyn Taylor on "'Satellite Cities" in the Survey Fig. 174. Map Showing that Factory Workers of Norwood and OaJdey (Cincinnati) Live Long Distances from Their Work, Many in the Heart of Cincinnati Rather than in the Sub- urbs Near the Factories The use of much heavier Hues on the small…
Graphic methods · Statistics
Internet Archive · Cornell University Library · Public domain (published before 1931). Free to use for anything.