Brinton, Willard Cope, 1880- · New York, The Engineering magazine company · leaf 234
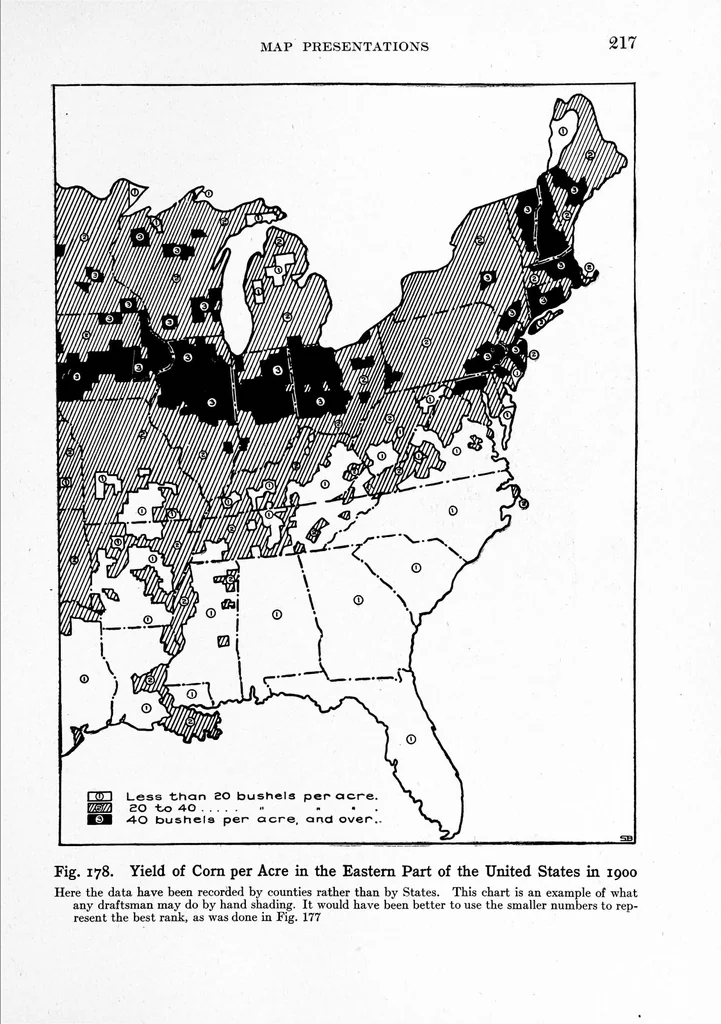
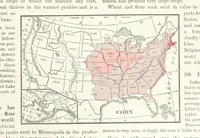
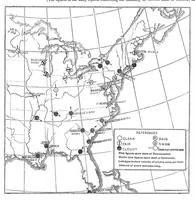
217 MAP PRESENTATIONS Fig. 178. Yield of Com per Acre in the Eastern Part of the United States in 1900 Here the data have been recorded by counties rather than by States. This chart is an example of what any draftsman may do by hand shading. It would have been better to use the smaller numbers to…
Graphic methods · Statistics
Internet Archive · Cornell University Library · Public domain (published before 1931). Free to use for anything.