Brinton, Willard Cope, 1880- · New York, The Engineering magazine company · leaf 57
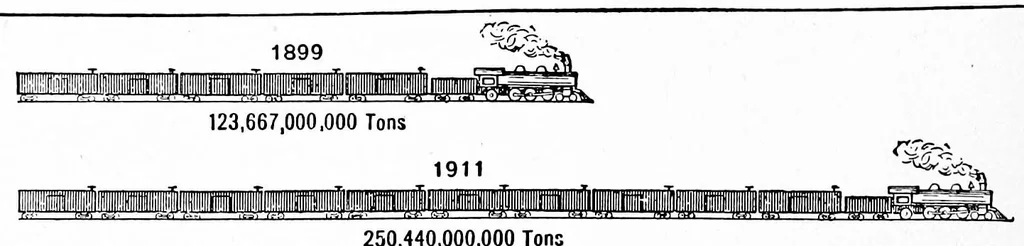
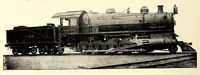
GRAPHIC METHODS 40 … 250.440,000,000 Tons WoTld's Work Comparison of the Total Amount of Freight Service on the Raikoads of Fig. 42. the United States in 1899 and in 191 1 It would have improved this illustration if the two locomotives had been shown one exactly above the other facing to the left. The additional cars…
Graphic methods · Statistics
Internet Archive · Cornell University Library · Public domain (published before 1931). Free to use for anything.