Brinton, Willard Cope, 1880- · New York, The Engineering magazine company · leaf 97
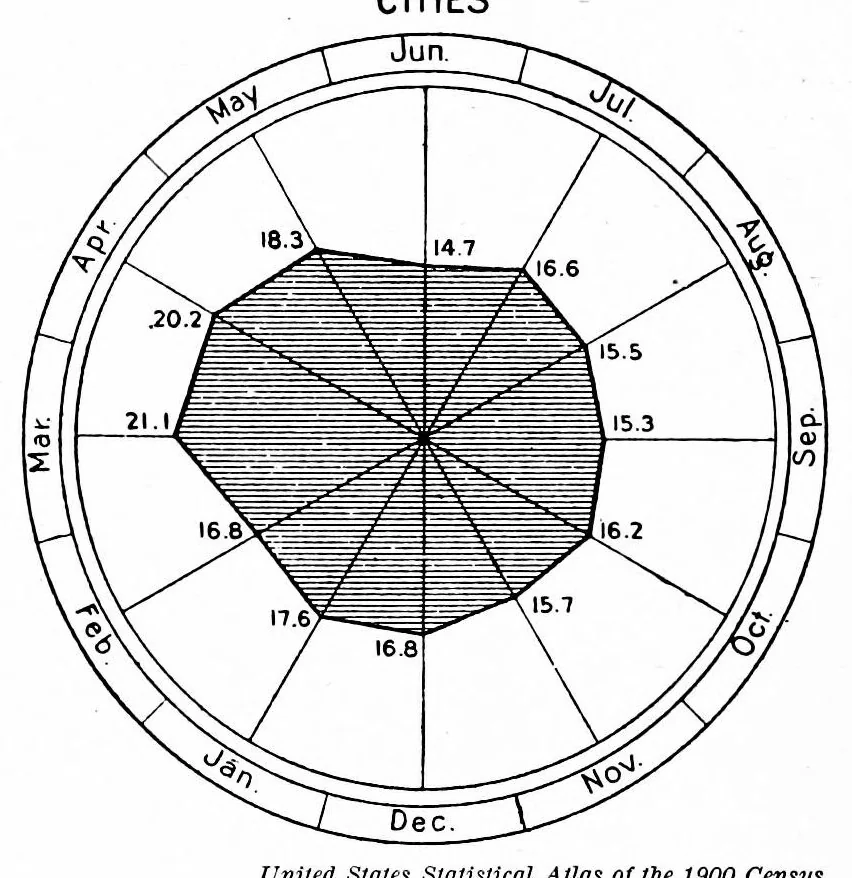
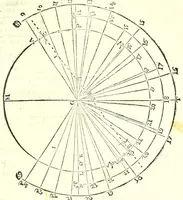
ODS right side of the chart. If only one scale is used, it should be placed at the left-hand side of the chart. In very large charts it is some- times desirable to repeat the scale at the right-hand side as well. Where two different units of measurement are used in the scales, the units should be… … understand as when shown by United States Statistical Atlas of the 1900 Census Fig. 78. Death Rate from Consumption per the radial scheme (polar co- 1000 Inhabitants for Each Month of the ordinates) of Fig. 78. There Year in Cities of the United States This type of chart should be banished to the…
Graphic methods · Statistics
Internet Archive · Cornell University Library · Public domain (published before 1931). Free to use for anything.