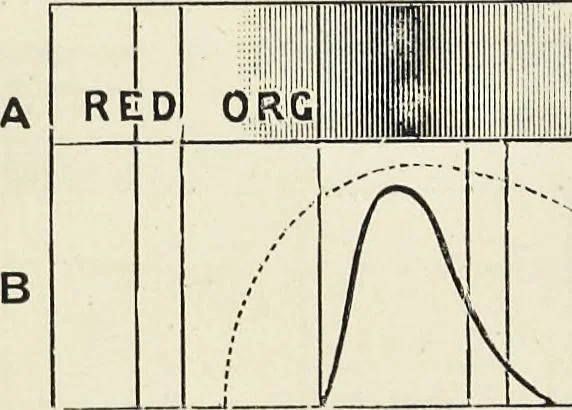
pose of illustration let magenta be againtaken, and its absorption spectrum in Fig. 20 is representedaccording to two methods, i.e., A by shading the absorbedportions of the spectrum, and B by the absorption curve. Itwill be seen that the region of absorption lies in the brightestpart of the… … BLUE VIOLET ABCDE F G H Fig. 20.—Absorption spectrum of magenta represented by shading (A), and byan absorption curve (B). The dotted curve represents a strong solutionof magenta showing an increased absorption. The richer the colour is, or the more concentrated the dyesolution becomes, the…
Color in the textile industries · Dyes and dyeing
Internet Archive · Getty Research Institute · Public Domain Mark 1.0. Free to use for anything.