Smithsonian Institution · Washington : Smithsonian Institution · leaf 177
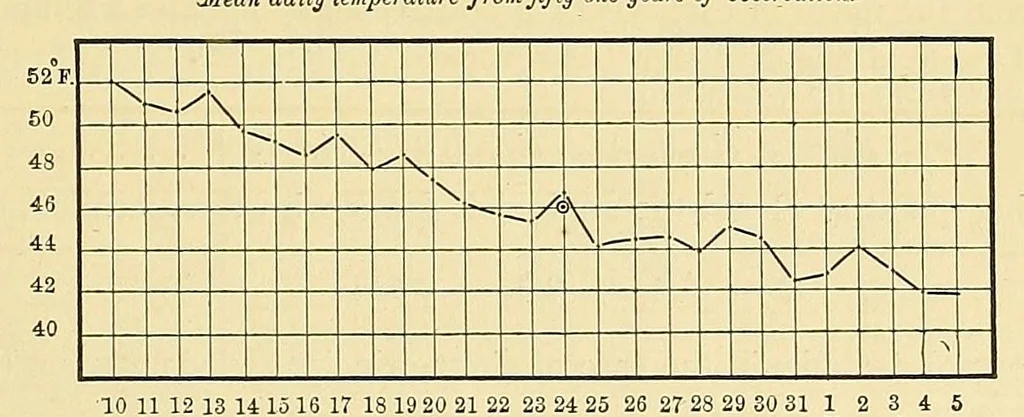
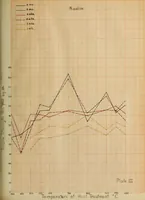
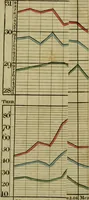
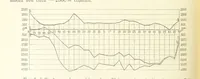
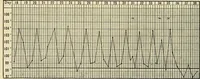
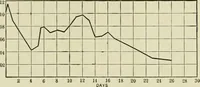
es in the regu- lar march of the annual fluctuation. To test this supposition the daily means from 51 years of observations were made out (vide Table 1), and laid down graphically on the two annexed diagrams, which cover, in time, the periods named above. These diagrams show the daily irregularity… … The dots surrounded by a small circle indicate the temperature as computed by the formula for the annual fluctuation and corrected for diurnal inequality. 4 Dr. Wilson, of Geneva, N. Y., was led to suppose, from twelve years of observation at that place, that a cold period occurred about the end of…
Science
Internet Archive · Smithsonian Libraries · Public domain (published before 1931). Free to use for anything.