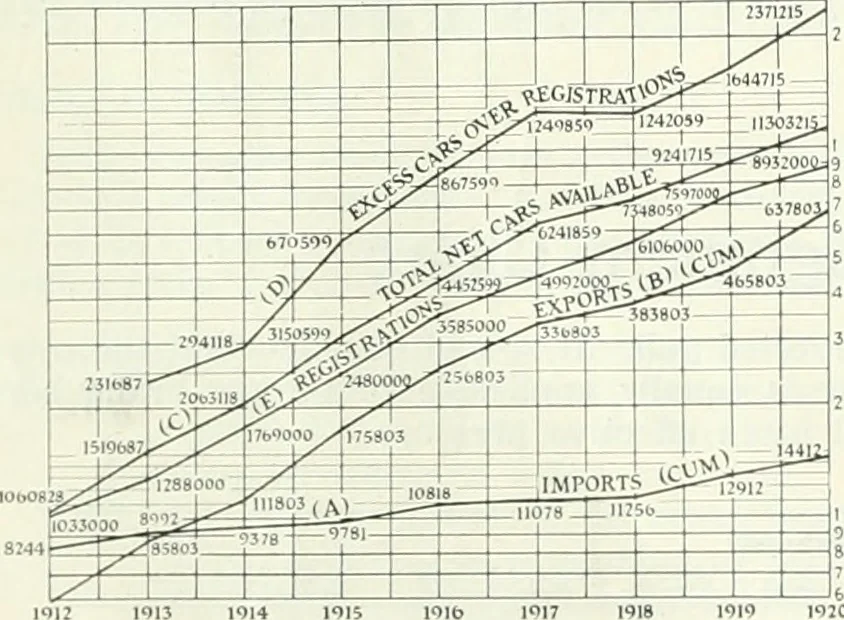
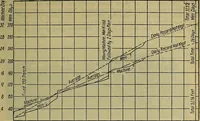
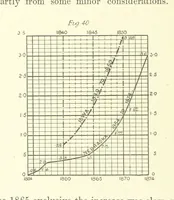
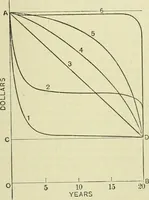
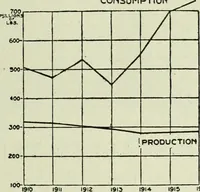
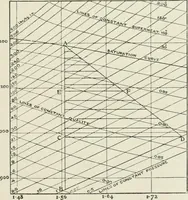
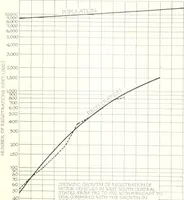
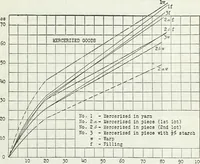
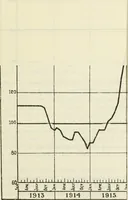
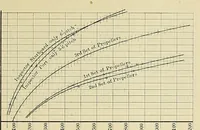
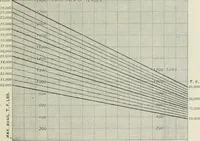
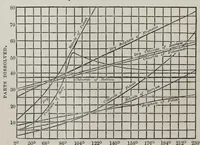
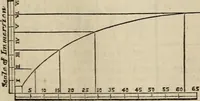
resting waythe comparative relationship between the various factorsinvolved. It is not necessary to go into a detailed discussion of thevarious charts since the individual purpose of each one isdefinitely stated in the caption. Some of the data is plottedon regular rectangular ccordinate paper with… … Chart 2 (right) plot on semi-log paperof (A) the total production plus im-ports minus exports and is cumulative.Curve B shows the excess of cumula-tive available production plus importominus exports, over registrations. Byrunning back horizontally to curve Aand measuring the intercept betweenthe…
Automobiles · Aeronautics
Internet Archive · University of Toronto Libraries · Public Domain Mark 1.0. Free to use for anything.