Brinton, Willard Cope, 1880- · New York, The Engineering magazine company · leaf 223
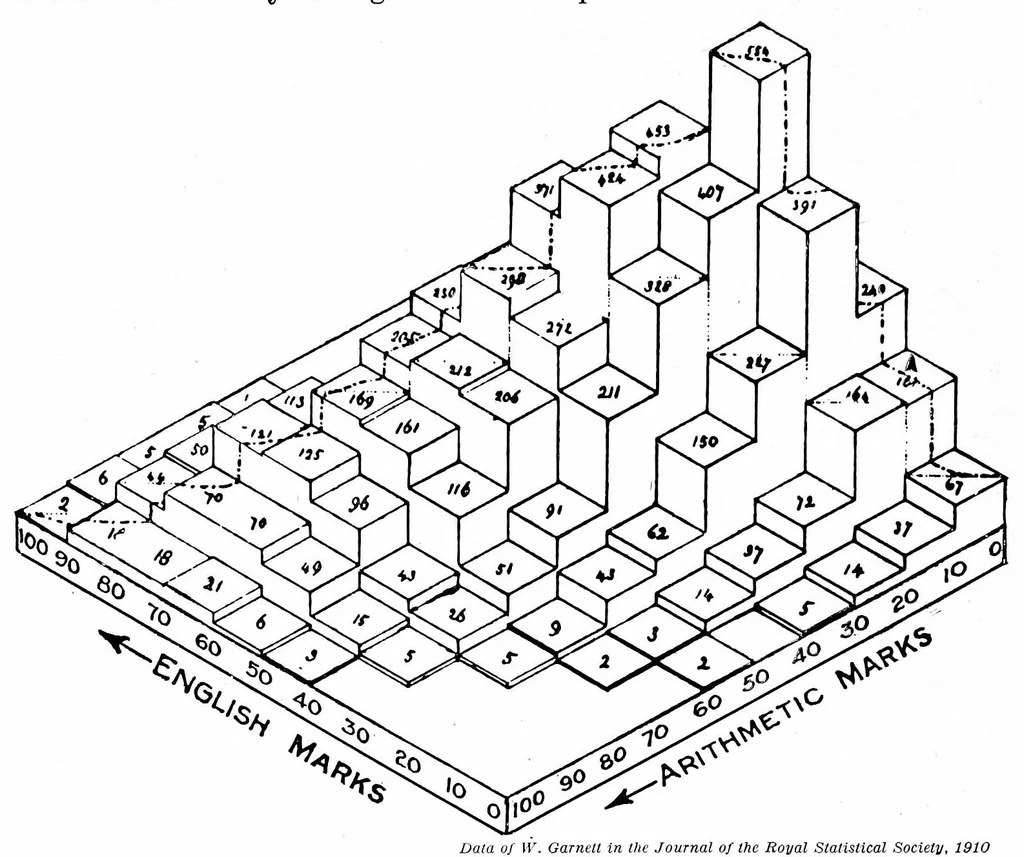
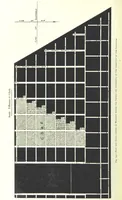
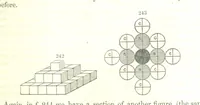
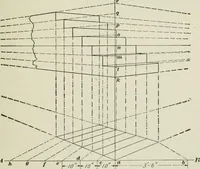
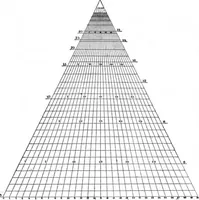
lecting a vertical scale to portray by separate columns the number of girls represented in any square of Fig. 166, it becomes a comparatively simple matter to draw the illustration. The various necessary lines can be drawn free- hand in pencil on top of the isometric co-ordinate ruling, until the… … Daia of \V. GarneiL in ihc Journal of the Royal Statistical Society, 1910 Fig. 167. Examination Marks Obtained by 9,396 School Girls in England This illustration was made from the same data as Fig. 166. Here the number of girls in any square is shown by the height of the vertical column drawn to…
Graphic methods · Statistics
Internet Archive · Cornell University Library · Public domain (published before 1931). Free to use for anything.