Brinton, Willard Cope, 1880- · New York, The Engineering magazine company · leaf 25
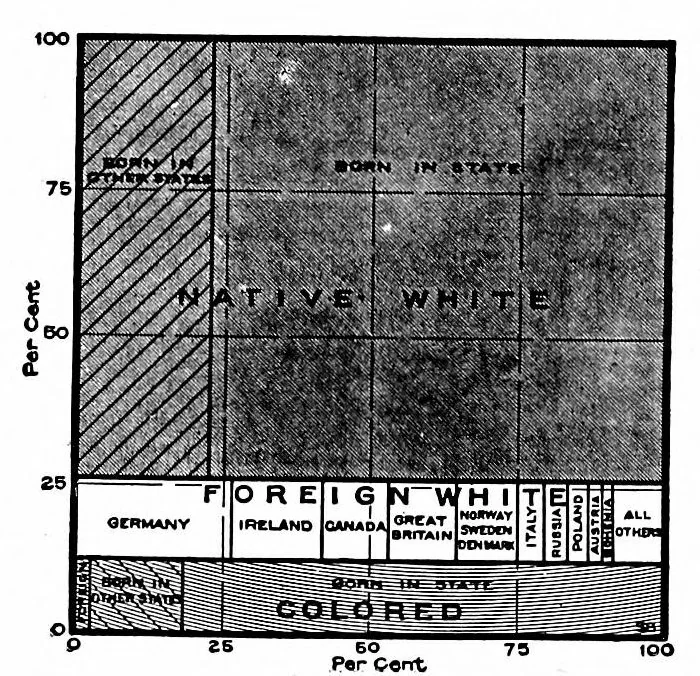
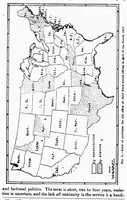
on at both beginning and end of the component to be measured. The best thing in charts of this kind is to use unruled paper, and specify the scale. The reader, if he wants the exact data, can take his measurements with a ruler. The engineer's scale has its sub- divisions in decimals and hence is… … within the group. The combined length of the four bottom bars is equal to the I I I I i=f Scale fo inch equals 5 perceni United Slates Statistical Atlas for the Census of 1900 length of the total-population bar Fig. 5. Elements of the Population shown at the top. These same data of the United…
Graphic methods · Statistics
Internet Archive · Cornell University Library · Public domain (published before 1931). Free to use for anything.