Brinton, Willard Cope, 1880- · New York, The Engineering magazine company · leaf 134
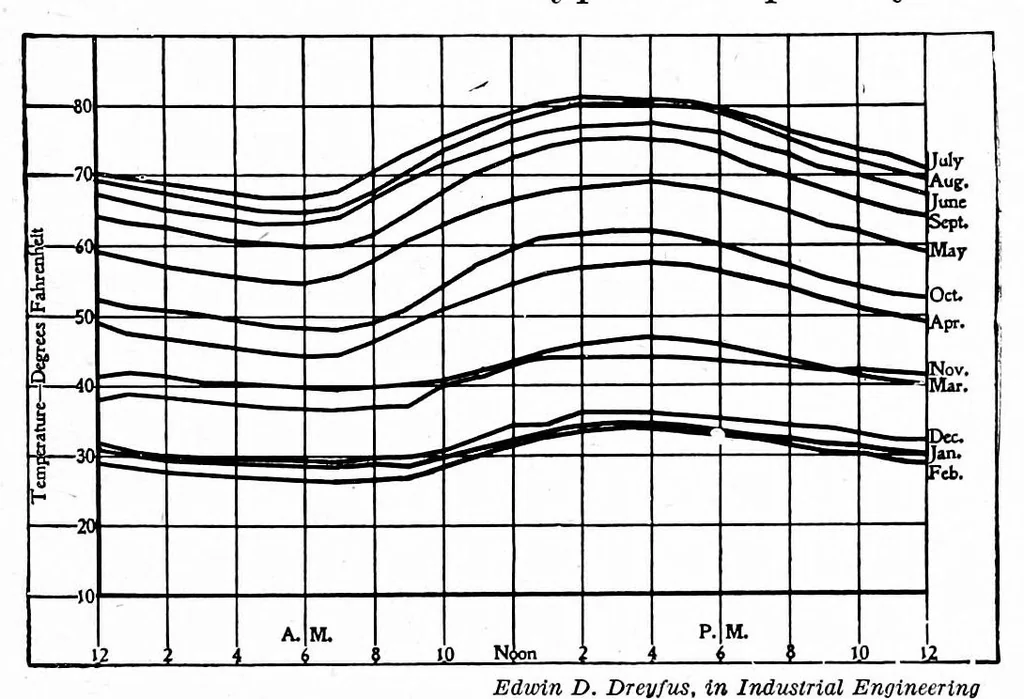
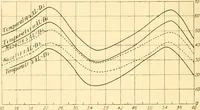
117 COMPARISON OF CURVES in this chart that the December points have not been repeated at the left and the reader is forced to glance between left and right in order to make certain in his own mind just what changes occurred from December to January each year. It can be seen that the January… … explanatory. They EdiDin D. Dreyfus, in Indusirial Enoineering Fig. io6. Average Temperature at Pittsburgh, Pa., for show some interest- Each Hour in the Day for Different Months in the ing applications of Year. Plotted for Monthly Averages of Twenty- Years Observations (1891-1910) of the United…
Graphic methods · Statistics
Internet Archive · Cornell University Library · Public domain (published before 1931). Free to use for anything.