Brinton, Willard Cope, 1880- · New York, The Engineering magazine company · leaf 161
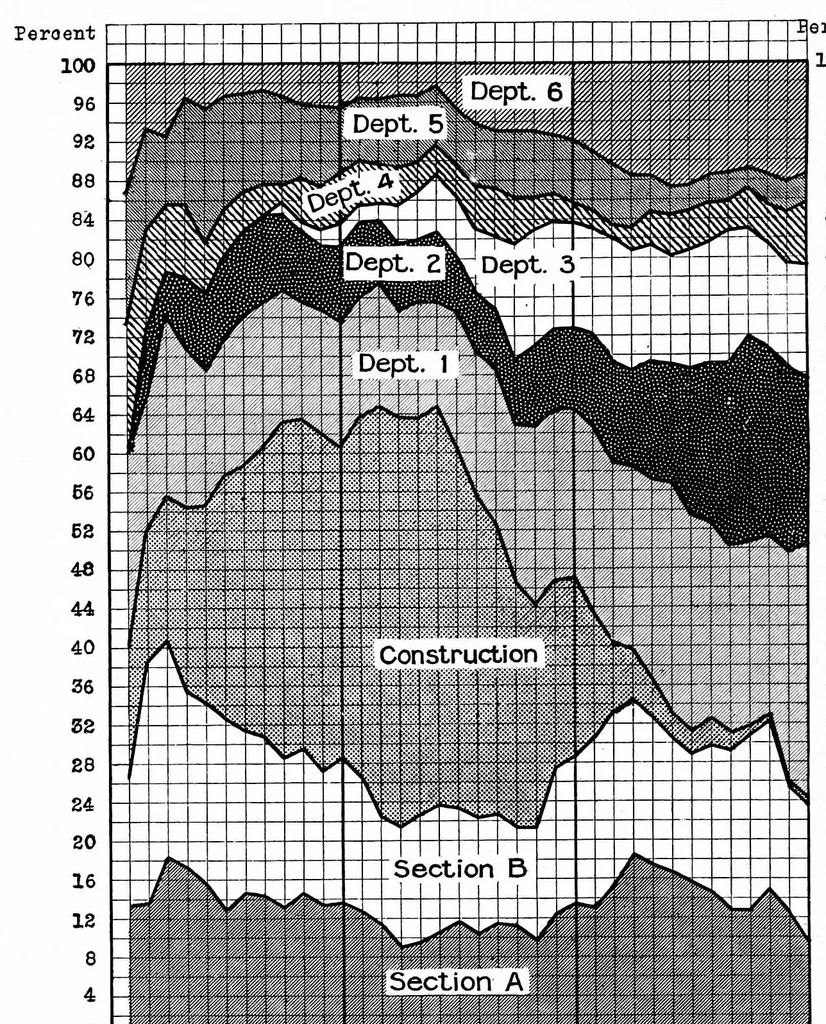
144 GRAPHIC METHODS HuEi"ber of aooldente occurring in each department, as rERCEMTASES OF THE TOTAL. 12 Months Averages. … ^-,f..|. . 0 0>OHNHMn'4<lO<Ot-CDa>Oi-4NHNtOTl<lOtOK-a}0>OHMH01l<}Ti<U)OC-CQ ~Sri 1910-11 1912-13 1911-12 Fig. 130. Percentage of Accidents Occurring in Each Department of a Large Industrial Plant. Plotted Monthly by Twelve-month Averages By this method, with a consteint width to represent 100 per…
Graphic methods · Statistics
Internet Archive · Cornell University Library · Public domain (published before 1931). Free to use for anything.