A graphic study of sounds waves emitted by singing tubes (1920)
Lapp, Claude Jerome · leaf 60
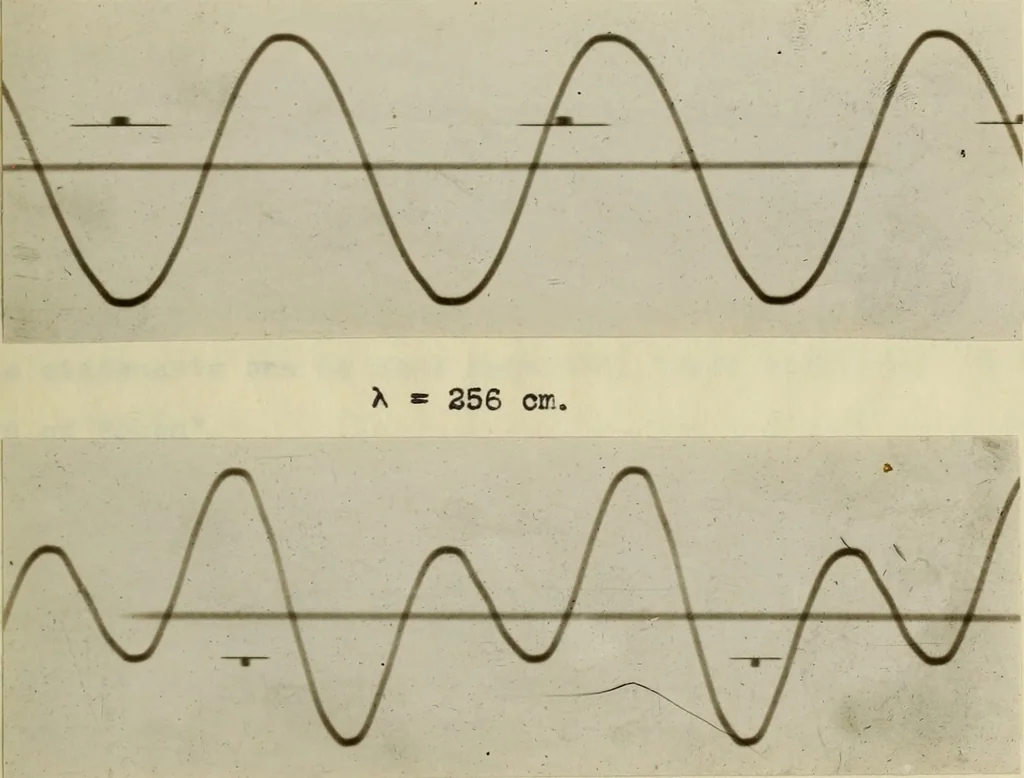
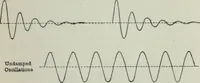
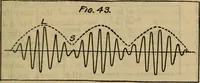
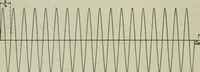
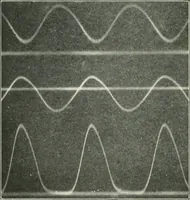
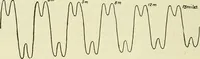
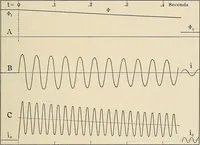
nsiderable pressure so as to produce overtones in each one.This is not a hap-hazard curve as it appears at first sight, but rather an ordered succession of a single configuration, three ofwhich appear on the photograph. Wave G represents a note from aFrench horn. The wave forms represented in B, E,… … h = 284 cm. These two photographs were taken by Professor D. C. Millerwith his phonodeik, of sounds emitted by the L-form of tube. Thewater columns were adjusted to +11. 2 cm. and +16.2 cm. respectively which caused a wave length of *2260 * 256 cm« > *2261 c 284 cm* to be produced. The slight…
Sound-waves · Theses
Internet Archive · University of Illinois Urbana-Champaign · Public Domain Mark 1.0. Free to use for anything.