Hartmann, Francis M., 1870- · New York, McGraw-Hill · leaf 227
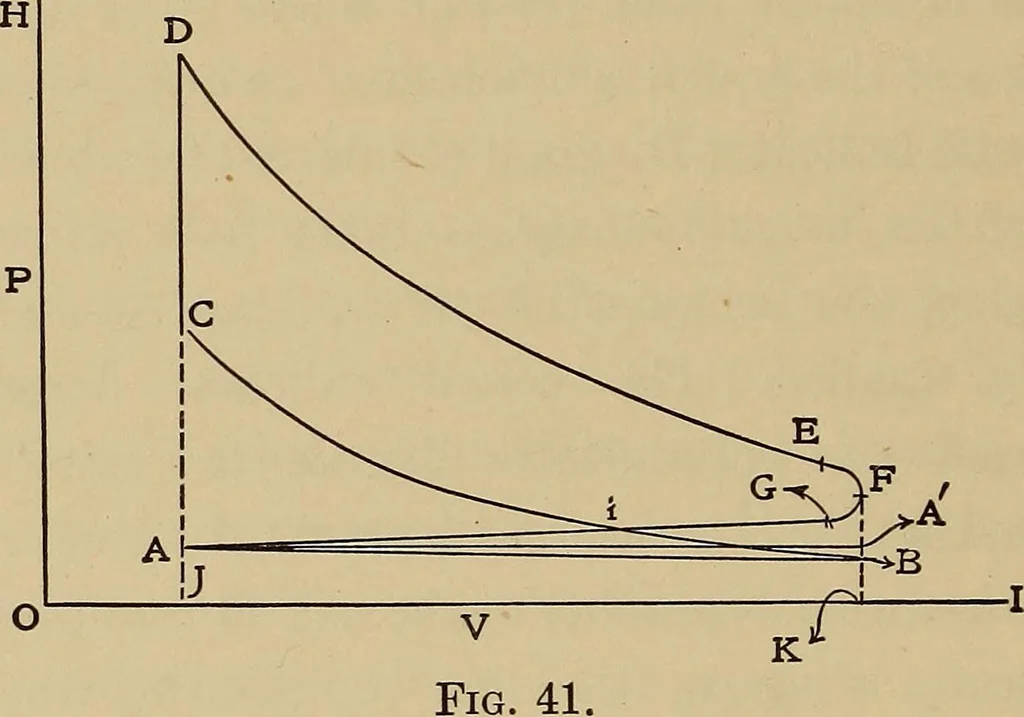
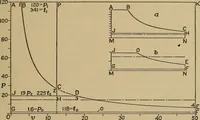
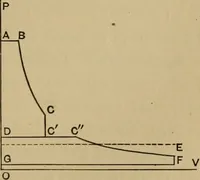
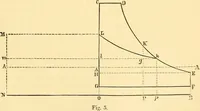
The expulsion stroke thenbegins, and the pressure continues to decrease rapidly up to thepoint G. At this point, the exhaust-valve is fully open and thepressure decreases gradually as represented by the curve GA, tothe end of the stroke, where the pressure is practically atmos-pheric, and the cycle… … That part of the diagram, which represents the effects due tothrottling, has been purposely exaggerated. The curve DE is usually, more or less, wavy; this may bedue to various causes. If the vibrations appear to be regular andof decreasing amplitude, they are principally due to the inertia ofmoving…
Heat · Thermodynamics
Internet Archive · Library of Congress · Public Domain Mark 1.0. Free to use for anything.