Hartmann, Francis M., 1870- · New York, McGraw-Hill · leaf 235
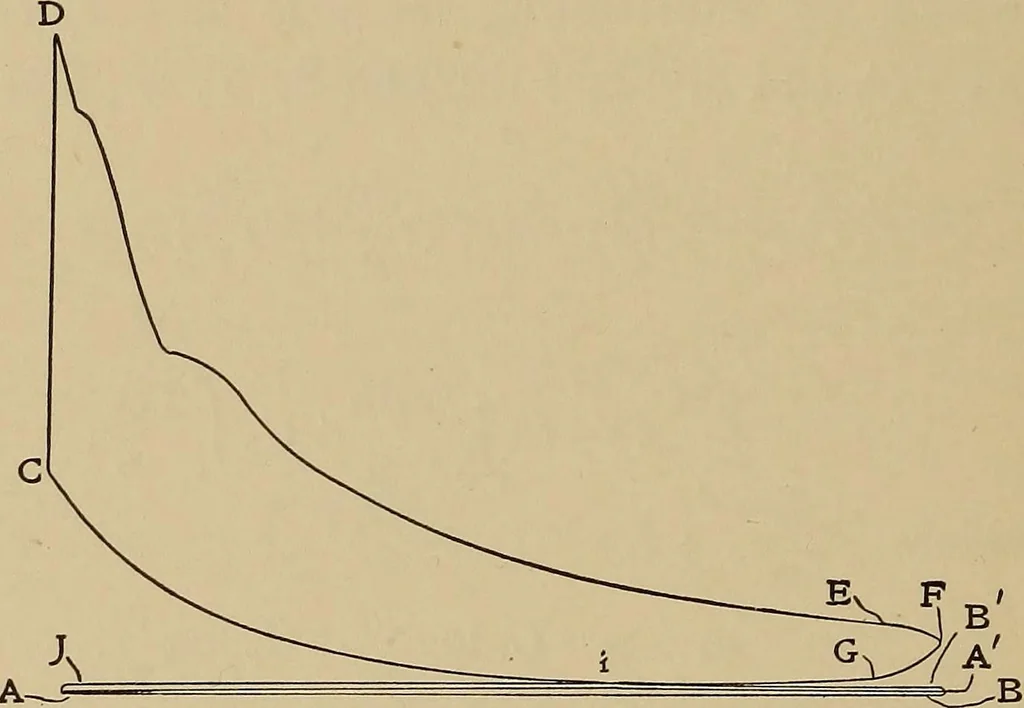
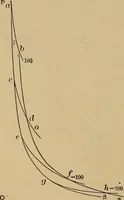
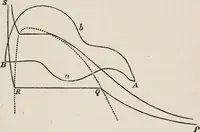
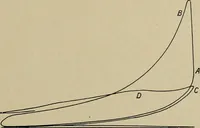
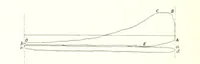
i(f2-?i)=log^+«log^; .... (13) 224 THERMODYNAMICS and since the scale employed, in plotting the T-y diagram isarbitrarily chosen, we may drop the factor 1/& and employ theequation ... (14) 92-91 = log—+nlog-. Fig. 43 is a reproduction of an indicator diagram taken froman 8 H.P. Fairbanks gas… … o v I Fig. 43. 01 is the axis of zero pressure, obtained by measuring down,to proper scale, from the atmospheric line, AA, a distance repre-senting the instantaneous barometric reading. OH is the axisof zero volume, obtained by measuring, to proper scale, to theleft of the point A, a distance…
Heat · Thermodynamics
Internet Archive · Library of Congress · Public Domain Mark 1.0. Free to use for anything.